23.3 Identifying features of global graphs
There are other important features of graphs that we can identify. In this section, we will learn how to find
the maximum and minimum points on a graph and we will also learn the difference between discrete graphs and
continuous graphs.
Maximum and minimum points
The maximum point on a graph is the point where the dependent variable has its greatest value.
The minimum point on a graph is the point where the dependent variable has its smallest value.
- maximum point
- on a graph, the point where the dependent variable has its greatest value
- minimum point
- on a graph, the point where the dependent variable has its smallest value
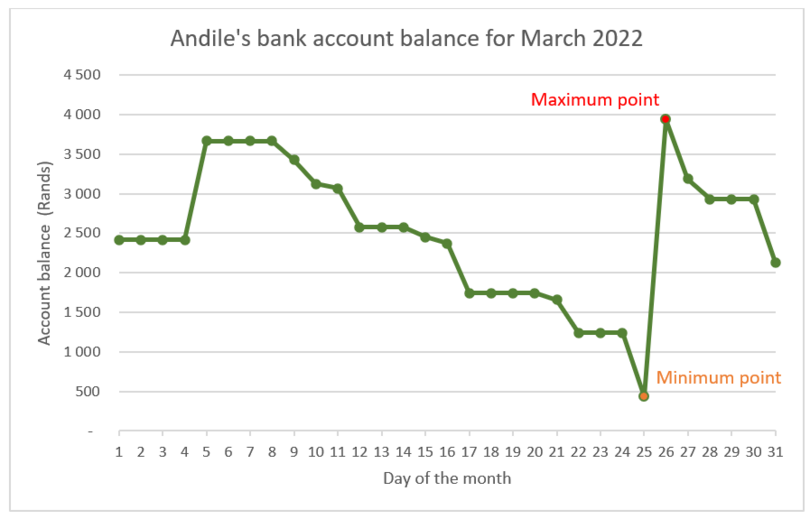
The graph below shows how Andile’s bank account balance changes over a one-month period.
- The maximum value of his bank account for the month was approximately \(\text{R}\,\text{3 900}\) on the 26th.
- The minimum value of his bank account was approximately \(\text{R}\,\text{450}\) on the 25th.
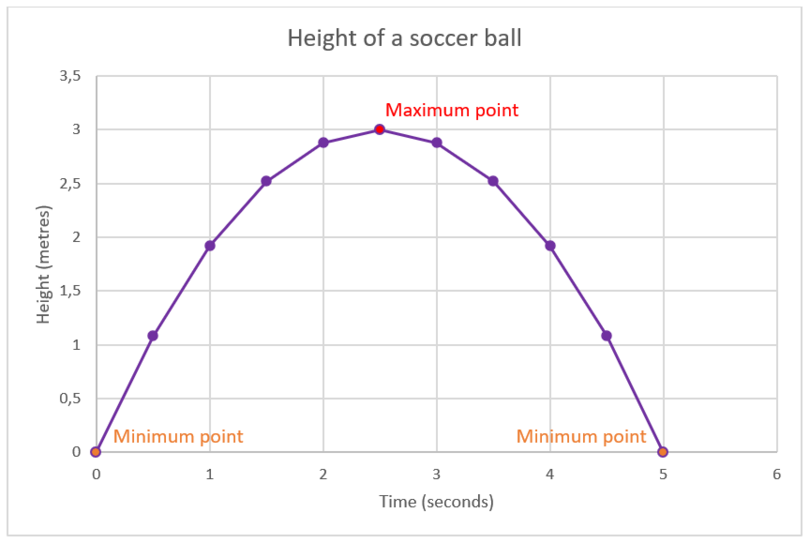
The graph below shows the change in height when a soccer ball is kicked.
The graph has one maximum point:
- the maximum height of the ball is \(3\) metres at a time of approximately \(\text{2,5}\) seconds.
The graph has two minimum points:
- before the ball is kicked (height is 0 metres when time is \(0\) seconds)
- when the ball falls back to the ground (height is \(0\) metres when time is \(5\) seconds).
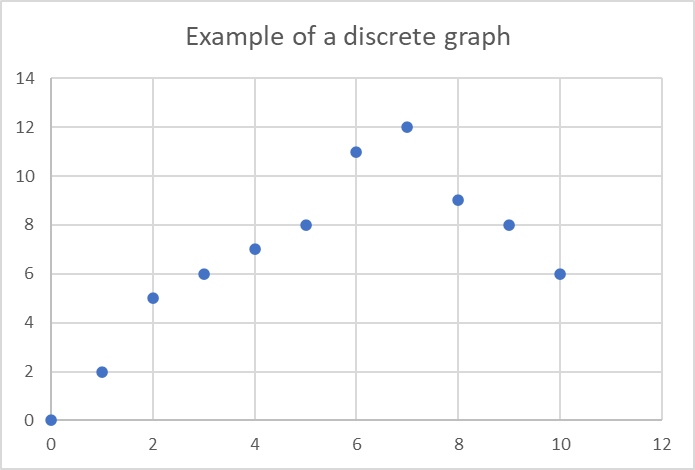
Discrete and continuous graphs
Test yourself now
High marks in science are the key to your success and future plans. Test yourself and learn more on Siyavula Practice.
Sign up and test yourself
Exercise 23.1
Use the graph to answer the questions.
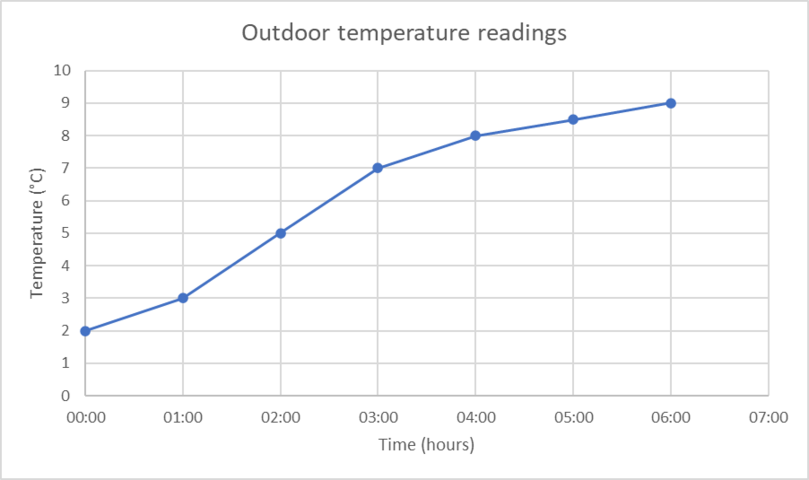
- Is the graph discrete or continuous?
- Name the independent variable.
- Name the dependent variable.
- What is the minimum point on the graph?
- What is the maximum point on the graph?
- By how many degrees did the temperature increase between 01:00 and 04:00?
- Continuous
- Time
- Temperature
- \(2 ^{\circ}\text{C}\) when time is 00:00
- \(9 ^{\circ}\text{C}\) when time is 06:00
- Change in temperature is \(8 − 3 = 5 ^{\circ}\text{C}\)
- Write a sentence to describe the information shown in the graph.
- Is the graph discrete or continuous?
- Name the independent variable.
- Name the dependent variable.
- What is the minimum point on the graph?
- What is the maximum point on the graph?
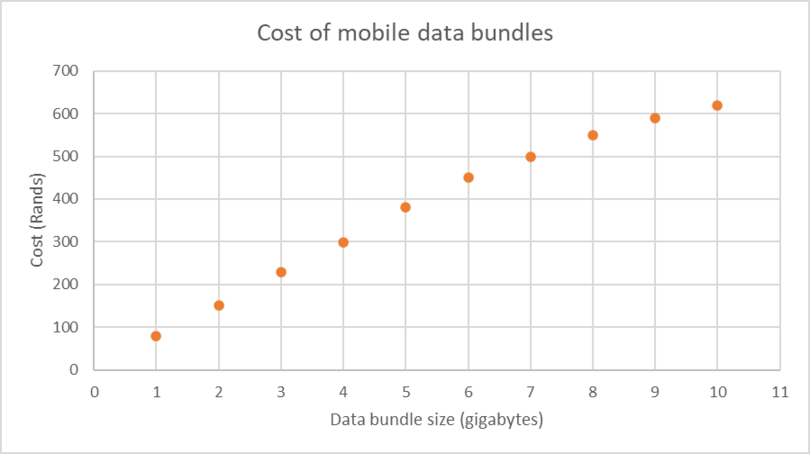
- Would it be better value for money to buy one 8 GB bundle or two 4 GB bundles?
1 MB = 1 megabyte = \(10^6\) = \(\text{1 000 000}\) kilobytes
1 GB = 1 gigabyte = \(10^9\) = \(\text{1 000 000 000}\) kilobytes
- The graph shows the cost (in rands) of different data bundles ranging from 1 GB to 10 GB.
- Discrete
- Data bundle size
- Cost
- Approximately R610 for 10 GB
- Approximately R90 for 1 GB
- 8 GB costs approximately R550
- \(2 \times (\text{R}\,\text{300 for 4 GB}) = \text{R}\,\text{600 for 8 GB}\)
It is better value to buy 8 GB at \(\text{R}\,\text{550}\).
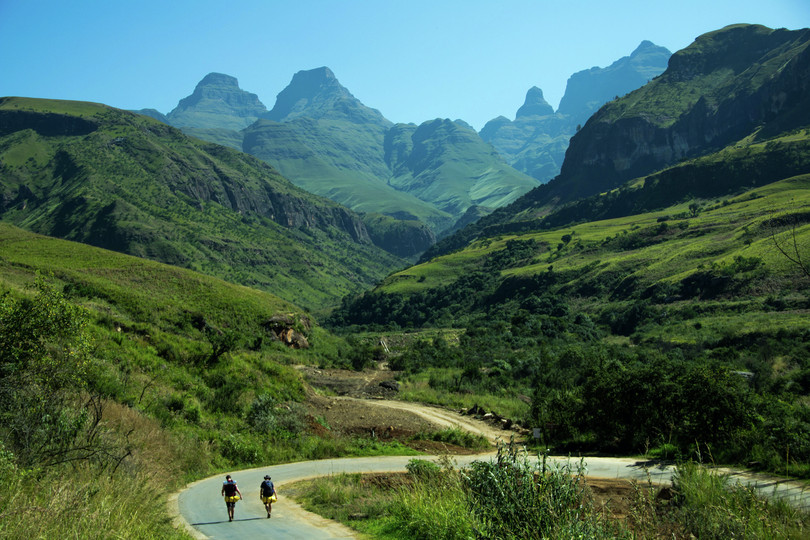
Two hikers climb the Sentinel Peak in the Ukhahlamba-Drakensberg mountains. Use the diagram to answer
the
questions.
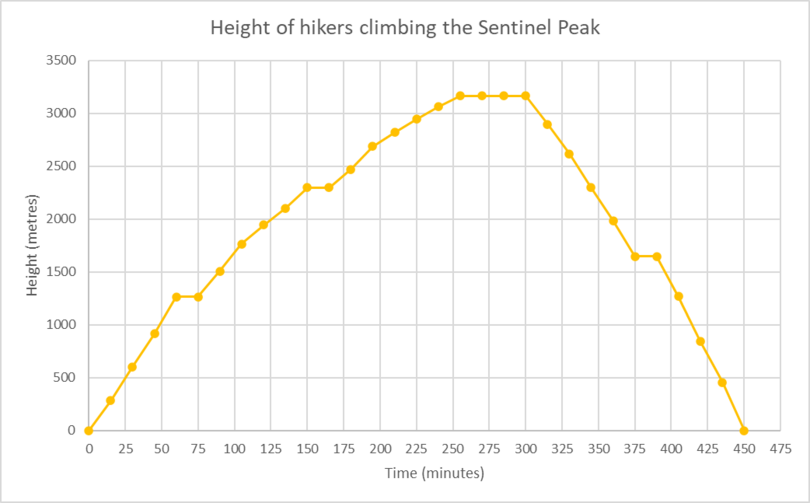
- Is the graph discrete or continuous?
- List two time intervals where the graph is increasing.
- List two time intervals where the graph is decreasing.
- List two time intervals where the graph is constant.
- What is the approximate height of the Sentinel Peak?
- How long did it take the hikers to reach the top of the peak?
- How many times during the hike did the hikers take a rest (stop hiking)?
- Continuous
-
Graph is increasing:
between 0 min and approx. 65 min
between 75 min and 150 min
between approx. 165 min and approx. 255 min
-
Graph is decreasing:
between 300 min and 375 min
between approx. 390 min and 450 min
between approx. 165 min and approx. 255 min
-
Graph is constant:
between approx. 65 min and 75 min
between 150 min and approx. 165 min
between approx. 255 min and 300 min
between 375 min and approx. 390 min
-
Approx. \(\text{3 200 m}\)
-
Approx. 255 min = 4 hours and 15 minutes
- The hikers rested four times during the hike.