If they win the prize money, how much will they have to share?
\(\text{R}\,\text{2 000}\)
|
Previous
2.3 Linear patterns, relationships and graphs
|
Next
2.5 Finding the rule or formula
|
Some relationships between quantities give patterns that form inverse proportion graphs. How do we recognise an inverse proportion relationship?
Remember from Chapter 1: in an inverse proportion, as one quantity decreases, the other increases OR as one quantity increases, the other decreases.
A rectangle has a fixed area of \(\text{32}\) square units, but the length \(l\) and breadth \(b\) can both change. If the length is smaller, the breadth gets bigger, because the area stays the same.
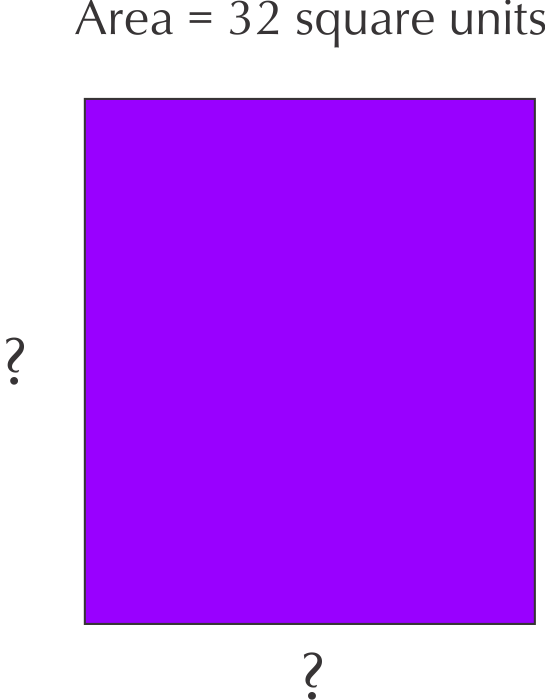
length \(l\) | \(\text{1}\) | \(\text{2}\) | \(\text{4}\) | \(\text{8}\) | \(\text{16}\) | \(\text{32}\) |
breadth \(b\) | \(\text{32}\) |
length \(l\) | \(\text{1}\) | \(\text{2}\) | \(\text{4}\) | \(\text{8}\) | \(\text{16}\) | \(\text{32}\) |
breadth \(b\) | \(\text{32}\) | \(\text{16}\) | \(\text{8}\) | \(\text{4}\) | \(\text{2}\) | \(\text{1}\) |
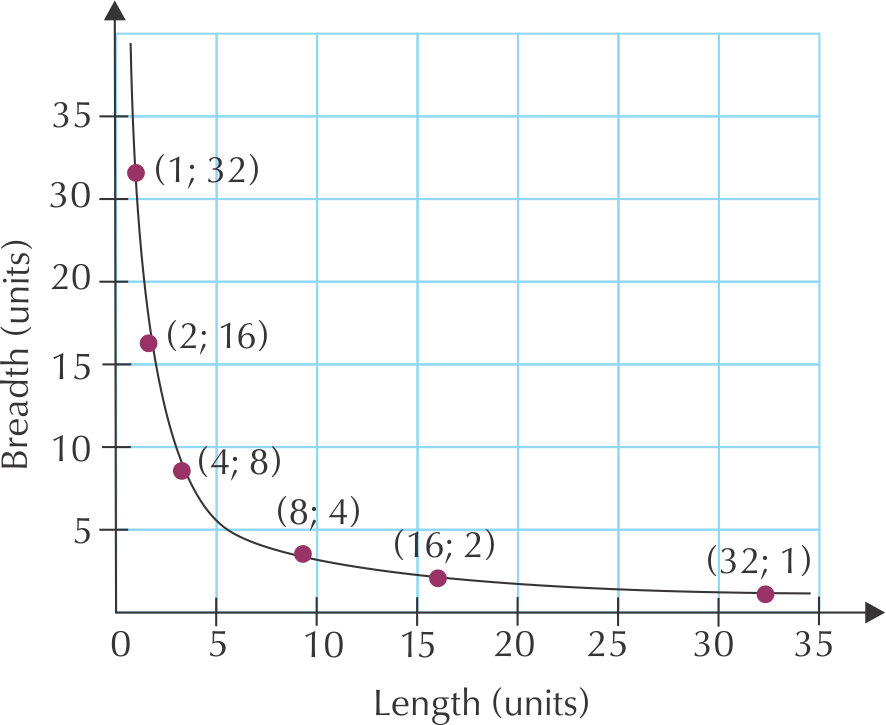
The important things to note about the graph of an inverse proportion is that it is a smooth curve, and that the curve never touches the axes. In most cases, we will deal with a positive inverse proportion, because most real life values are positive. But it is possible for them to be negative too.
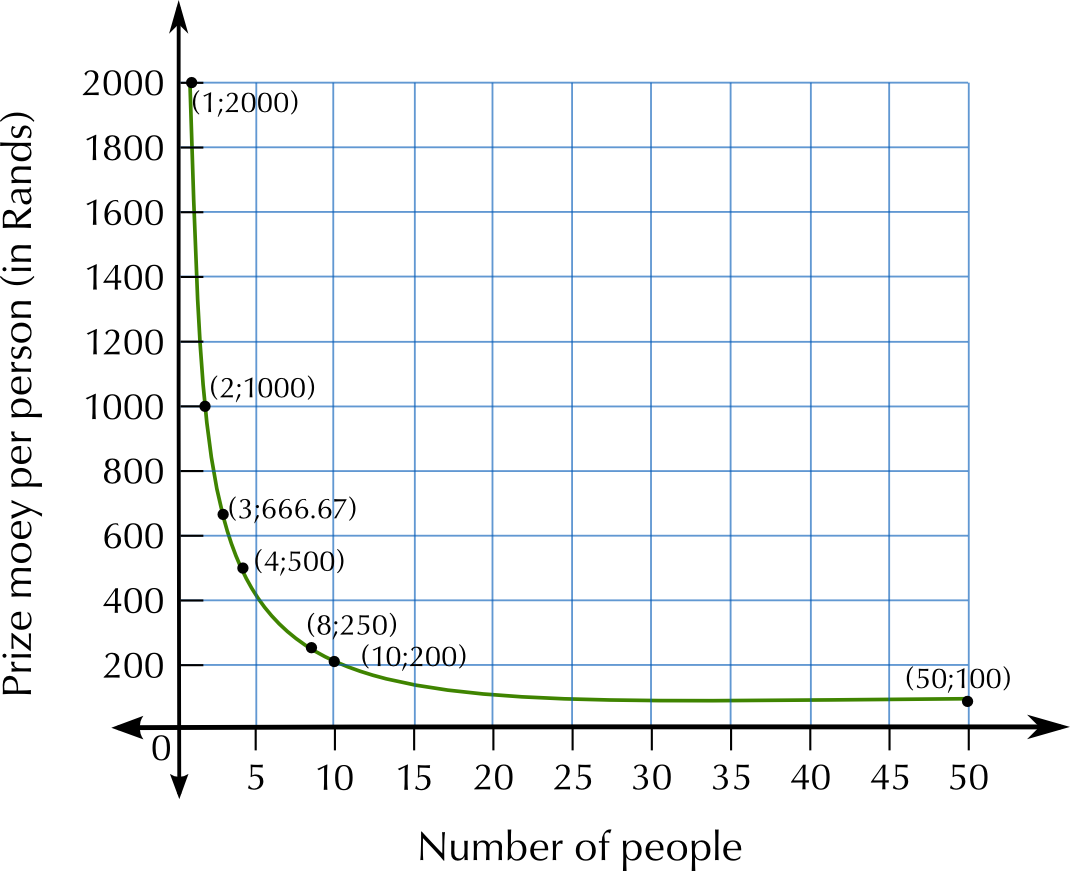
Lerato decides to get a group of friends together to play a lucky draw game. The bigger the group, the more tickets they can buy, but if they win, they will have to share the prize among more people. The total amount of money is \(\text{R}\,\text{2 000}\).
Number of people | \(\text{1}\) | \(\text{2}\) | \(\text{3}\) | \(\text{4}\) | \(\text{8}\) | \(\text{10}\) | \(\text{50}\) |
Share of the prize money | \(\text{2 000}\) | \(\text{1 000}\) |
Number of people | \(\text{1}\) | \(\text{2}\) | \(\text{3}\) | \(\text{4}\) | \(\text{8}\) | \(\text{10}\) | \(\text{50}\) |
Share of the prize money | \(\text{2 000}\) | \(\text{1 000}\) | \(\text{666,67}\) | \(\text{500}\) | \(\text{250}\) | \(\text{200}\) | \(\text{100}\) |
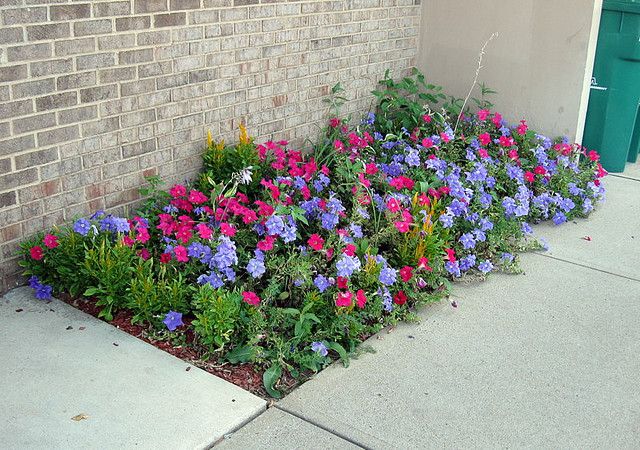
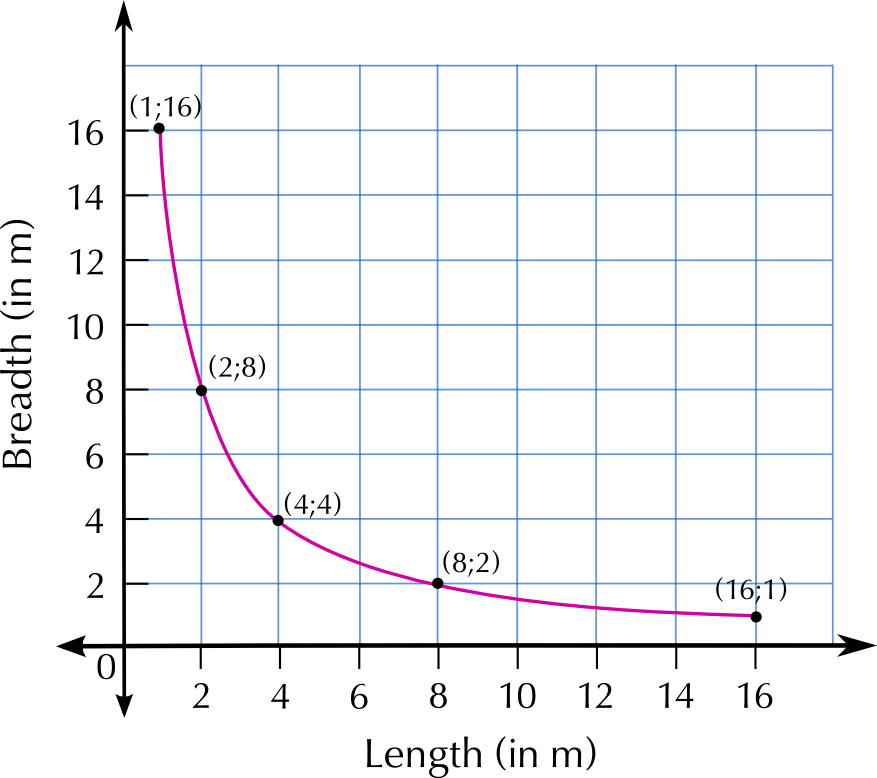
Meryl wants to make a garden bed with an area of \(\text{16}\) \(\text{m$^{2}$}\).
Draw up a table to show a few possible length and breadth measurements of the garden bed.
Breadth (m) | \(\text{1}\) | \(\text{2}\) | \(\text{4}\) | \(\text{8}\) | \(\text{16}\) |
Length (m) | \(\text{16}\) | \(\text{8}\) | \(\text{4}\) | \(\text{2}\) | \(\text{1}\) |
Do the measurements have to be whole numbers? Explain.
No. Any two numbers whose product is \(\text{16}\) can be used, because length and breadth are continuous variables. Whole numbers will be easier to calculate and plot on a graph, however.
Draw a graph to show the relationship between the length and the breadth of the garden bed.
|
Previous
2.3 Linear patterns, relationships and graphs
|
Table of Contents |
Next
2.5 Finding the rule or formula
|