20.2 Interpret data
We need to be able to interpret data so that we can use it to make informed decisions. Data can help to identify a situation that might need to be changed or improved and it can also make us aware of a situation that is better than we expected. For example, data collected on people’s weight could indicate the need for increased public awareness of healthier eating habits and regular exercise. A teacher might calculate the average exam results of her class, and find that the class marks have improved since the start of the term.
Worked example 20.1: Interpreting data from a histogram
A group of learners were asked about the total number of books they read last year. Their responses are summarised in the graph below. The number of books is shown on the horizontal axis and the number of learners on the vertical axis.
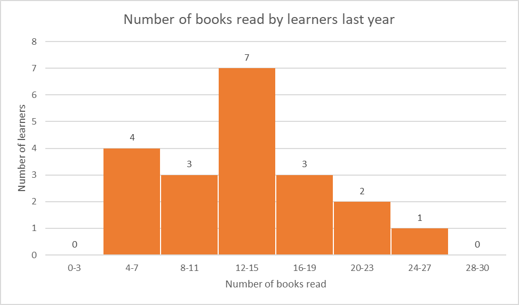
- What is the size of the intervals on the horizontal axis?
- What is the range of values for the number of books read?
- How many learners were interviewed?
- How many learners read between \(8\) to \(11\) books last year?
- How many learners read more than \(15\) books last year?
Determine the size of the intervals on the horizontal axis.
The size of each interval (also called bins) on the horizontal axis is \(3\) units.
Determine the range of values for the number of books read.
The number of books read ranges from \(4\) to \(27\).
Range = \(27 − 4 = 23\).
Find the number of learners who were interviewed.
To find the total number of learners, we add the number of learners represented by each bin: \(4 + 3 + 7 + 3 + 2 + 1= 20\).
Find the number of learners who read between \(8\) to \(11\) books last year.
The number of learners who read between \(8\) to \(11\) books last year is represented by the height of the third bin, which is \(3\).
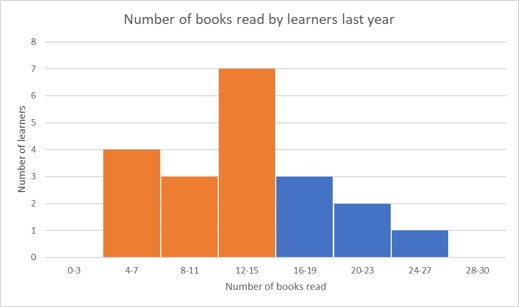
Find the number of learners who read more than \(15\) books last year.
To find the number of learners who read more than \(15\) books last year, we must add the values for the bins where the number of books is greater than \(15\) (shown in blue below).
Number of learners who read more than \(15\) books \(= 3+ 2 + 1 = 6\).
So \(6\) learners read more than \(15\) books last year.
Worked example 20.2: Interpreting data from a pie chart
The data shows the afterschool activities and hobbies of a group of learners. Use the data to answer the questions.
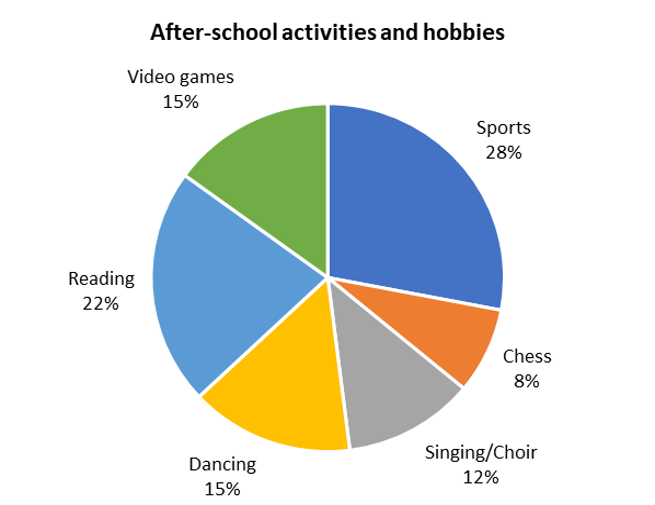
- Order the activities from most popular to least popular.
-
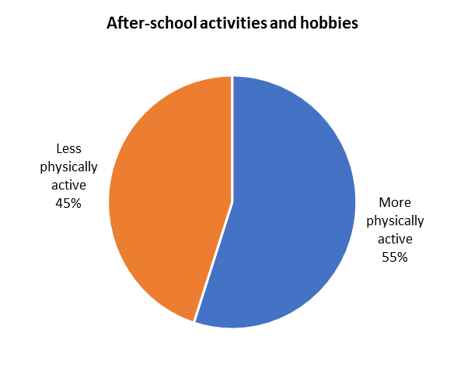
Categorise each activity/hobby as either:
More physically active Less physically active Represent this data as a pie chart.
- If \(50\) learners were asked about their interests and hobbies, how many learners like singing/choir practice?
Order the activities from most popular to least popular.
Using the data provided in the pie chart, we can arrange the hobbies in descending order according to the percentages:
Sports \((28 \%)\); Reading \((22 \%)\); Video games \((15 \%)\); Dancing \((15 \%)\); Singing/choir \((12 \%)\); Chess \((8 \%)\)
Categorise each activity as either more physically active or less physically active and draw a pie chart.
| More physically active hobbies | Less physically active hobbies | ||
|---|---|---|---|
| Sports | \(28 \%\) | Reading | \(22 \%\) |
| Dancing | \(15 \%\) | Video games | \(15 \%\) |
| Singing/Choir | \(12 \%\) | Chess | \(8 \%\) |
| Total | \(\mathbf{55 \%}\) | Total | \(\mathbf{45 \%}\) |
Calculate how many learners like singing/choir practice.
To determine the number of learners that like singing/choir practice, we multiple the percentage by the total number of learners:
\[50 \times 12 \% = 50 \times \frac{12}{100} = 6\]Therefore, \(6\) out of the \(50\) learners like singing/choir practice.