


Is the following data set symmetric, skewed right or skewed left? Motivate your answer.
\(\text{27}\) ; \(\text{28}\) ; \(\text{30}\) ; \(\text{32}\) ; \(\text{34}\) ; \(\text{38}\) ; \(\text{41}\) ; \(\text{42}\) ; \(\text{43}\) ; \(\text{44}\) ; \(\text{46}\) ; \(\text{53}\) ; \(\text{56}\) ; \(\text{62}\)
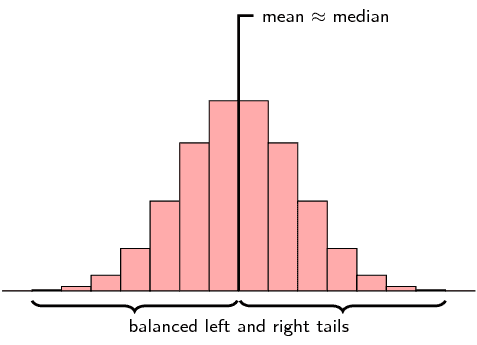
The statistics of the data set are
- mean: \(\text{41,1}\);
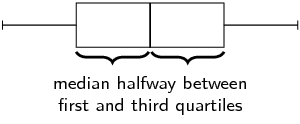
- first quartile: \(\text{33}\);
- median: \(\text{41,5}\);
- third quartile: \(\text{45}\).
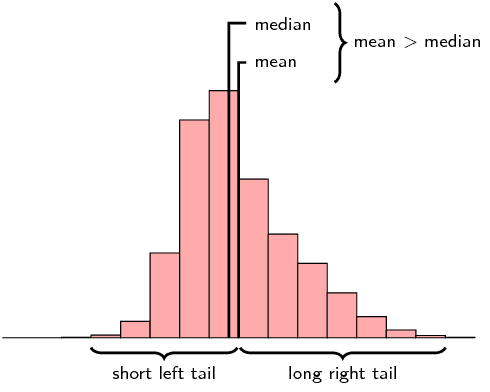
- The mean is less than the median. There is only a very small difference between the mean and median, so this is not a very strong reason.
- A better reason is that the median is closer to the third quartile than the first quartile.